A completed pass is useful information, but a completion percentage can become misleading when it is treated as a complete ranking of passing quality. Players attempt different actions from different positions. A short connection under little pressure and a pass through a crowded defensive line do not present the same challenge or potential reward. The percentage tells you how often recorded attempts succeeded under a particular definition. To understand a player's contribution, examine what those attempts tried to achieve and what the completed passes allowed the team to do next.
Read the numerator and denominator
Opta's published definition describes pass completion as successful passes divided by attempted passes within the selected set. It notes that crosses are usually treated separately. Other displays can use their own selection or presentation, so check the provider's explanation. A total-pass percentage and a figure for passes in a particular area are not interchangeable. The label needs to be read with the population of events it describes.
Use counts alongside the percentage. Nine completions from ten attempts and ninety from one hundred produce the same rate, but they do not represent the same involvement. A brief substitute appearance can create a small sample in which one event changes the percentage sharply. The figure is still calculable; the issue is the strength of the conclusion attached to it. A comparison should recognise how much evidence sits behind each displayed rate.
Inspect the starting and receiving positions
A player circulating possession near the back can have frequent short options. Another receiving between lines may try to turn or pass through a denser area. Neither role can be understood from a percentage alone. Watch where the player receives and where the pass is intended to go. A longer or more progressive action can have a different risk profile from a safe supporting pass, but distance itself does not explain every difficulty.

A short pass can be demanding when pressure closes the lane, while a long switch may be relatively open. Consider the position of opponents and the available angle. Do not assume that backwards passing is automatically unambitious. Returning the ball can change the point of attack or avoid a trapped receiver. The relevant question is whether the action improves the team's next options, not whether the pass travels in a direction that looks impressive in isolation.
Separate necessary risk from avoidable loss
A pass through a defensive line can create an advantage if it succeeds, but not every failed forward pass deserves praise for bravery. Ask whether a receiver and usable lane existed at the moment of delivery. A difficult but plausible connection is different from forcing the ball through a closed route while better options are available. The percentage records the failure in either case; observation helps explain the decision behind it.
Equally, a high rate can coexist with missed opportunities. A player may repeatedly choose an available safe pass while overlooking a valuable forward option. That claim needs evidence from the actual view and pressure, not a spectator's ideal passing line drawn through opponents. Compare several similar situations before describing a pattern. One conservative choice may be sensible in context, while repeated avoidance of a clearly usable route might tell a more interesting story.
Follow the receiver after a completion
A completed pass can leave the receiver under immediate pressure or on an awkward foot. Another can arrive at a useful pace and angle, allowing the player to continue forward. Both may count as successful deliveries, but they create different next actions. Watch body orientation, touch and the nearest opponent after the ball arrives. This helps distinguish a technically completed connection from one that actually improves the attacking situation.
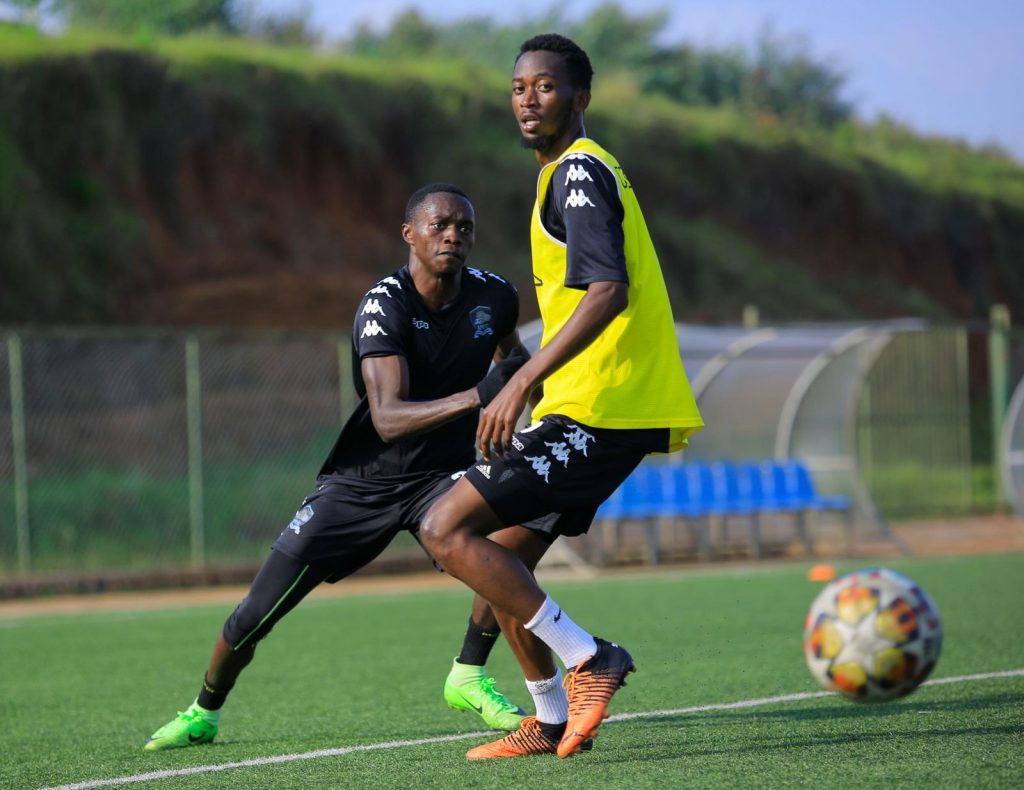
The receiver's movement also contributes. A teammate creating a clear angle can make a pass safer, while a late change of direction may turn an intended connection into an interception. Avoid assigning every outcome solely to the passer. Football passing is relational: delivery and receiving action need to fit. A fair explanation can identify the mismatch without pretending to know the private instruction or communication between the players.
Compare players within a football role
A comparison becomes more useful when players face similar tasks, but even then the team and opponent matter. One side may dominate territory while another spends long periods under pressure. A player asked to supply early forward passes is not undertaking the same work as a teammate connecting short circulation. Consider role, location and the match phase before attaching a general quality label to the difference in rates.
If the data allows it, examine selected pass types or areas using the same definitions. Then watch examples from both successful and unsuccessful attempts. A narrow metric can clarify a specific question, but adding filters does not automatically remove every contextual difference. Keep the claim proportionate. It may be possible to say one player completed more of the selected passes, while still needing observation to explain why and what those completions produced.
Write an account that describes the job performed
A strong summary might explain that a midfielder retained possession reliably while mainly connecting short options, or that a defender accepted more failed attempts while supplying a recurring route beyond pressure. Those statements connect the rate to the role. They are more informative than calling the highest percentage the best passer. Include the important limitations when the sample is small or the underlying selection is unclear.
Keep a few representative sequences rather than collecting only the spectacular successful pass or the most obvious mistake. The aim is to understand the pattern of decisions and execution. Pass completion is a helpful starting statistic because it is easy to calculate and compare. Its meaning comes from the football around the attempts: the problem each pass tried to solve, the risk involved and the options created for the teammate receiving it.